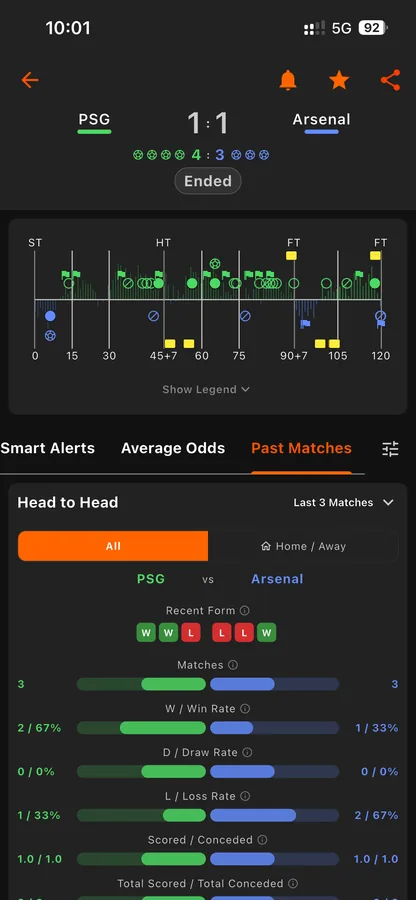
A win-draw-loss record tells you very little on its own. Goal Guru's Past Matches section goes several layers deeper, giving you a structured view of how teams have actually performed across recent fixtures and head-to-head meetings. Every metric is broken down to help you understand not just outcomes, but patterns.
Head-to-Head Comparison
The H2H view places both teams side by side across win rate, draw rate, loss rate, average goals scored and conceded, clean sheet percentage, BTTS rate, over-goal percentages, shot attempts, shot accuracy, and conversion rate. A Home / Away filter lets you narrow the data to the specific context of the upcoming fixture rather than relying on overall averages that can mask important splits.
Goal Distribution by Time Period
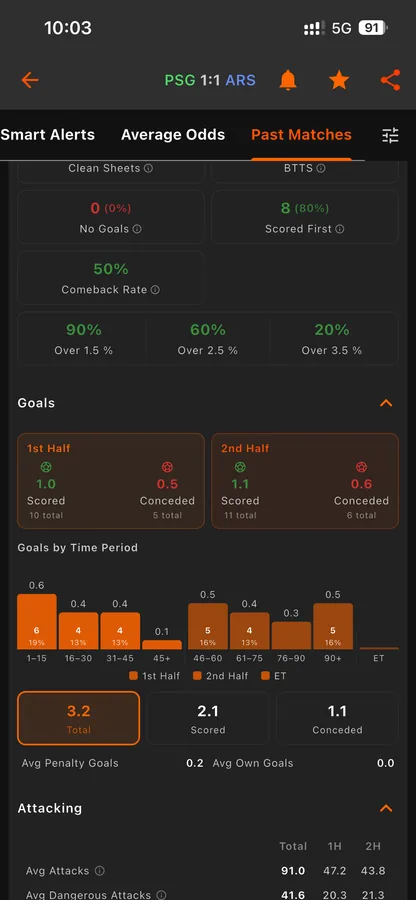
Goals are broken down into 15-minute windows across the full 90 minutes, split between first and second half. This reveals when a team tends to score and concede — information that an average goals-per-game figure completely hides. The Goals section also surfaces Comeback Rate, Scored First percentage, and summary cards for clean sheets, BTTS, and over 1.5 / 2.5 / 3.5 thresholds.
Attacking Averages and Shot Efficiency
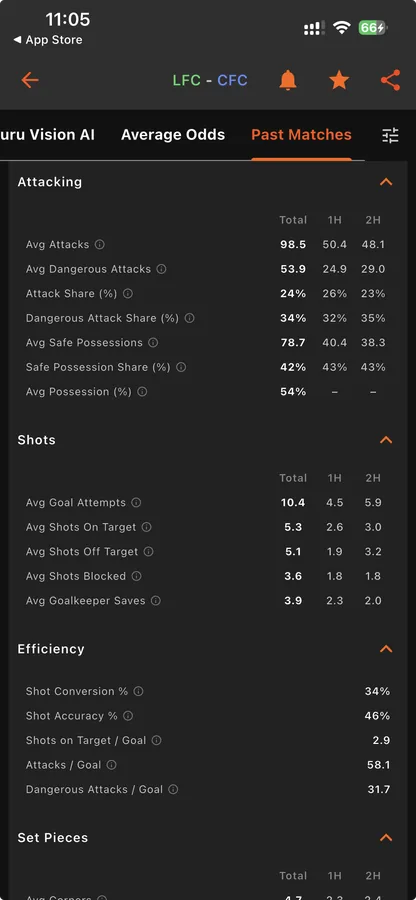
The Attacking section shows average attacks, dangerous attacks, and possession split across the full match and each half independently. The Efficiency section covers shot conversion rate, shot accuracy, shots on target per goal, attacks per goal, and dangerous attacks per goal — the metrics that separate high-volume but low-quality attacking from genuinely threatening teams.
Last 3, 5, or 10 Matches
Form changes fast, so every recent-form view can be narrowed to a team's last 3, 5, or 10 matches. Last 3 catches a team that has just changed manager or shape; Last 10 tells you whether that's a trend or a blip. Team pages also show ball-safe time — time spent in safe possession — next to dangerous attacks, and when a stat is based on fewer matches than the window you picked, the page says so ("based on 4 of 5 matches") instead of quietly averaging over less data.
What You Can Track
- Win, draw, and loss rates with home/away filter
- Last 3, 5, or 10 matches for recent form
- Goals by 15-minute period across first and second half
- Comeback rate and scored-first win percentage
- BTTS, clean sheet, and over-goal percentages
- Avg attacks and dangerous attacks split by half
- Shot conversion, accuracy, and efficiency ratios
- Set piece averages including corners and free kicks